
SOH-estimator
State of health estimation using charging signals and LSTMs
Acronyms
- SOH: State Of Health
- Closs: Capacity Loss
- LSTM: Long-Short Term Memory
- Li-Ion: Lithium-Ion
- POC: Proof Of Concept
Workflow
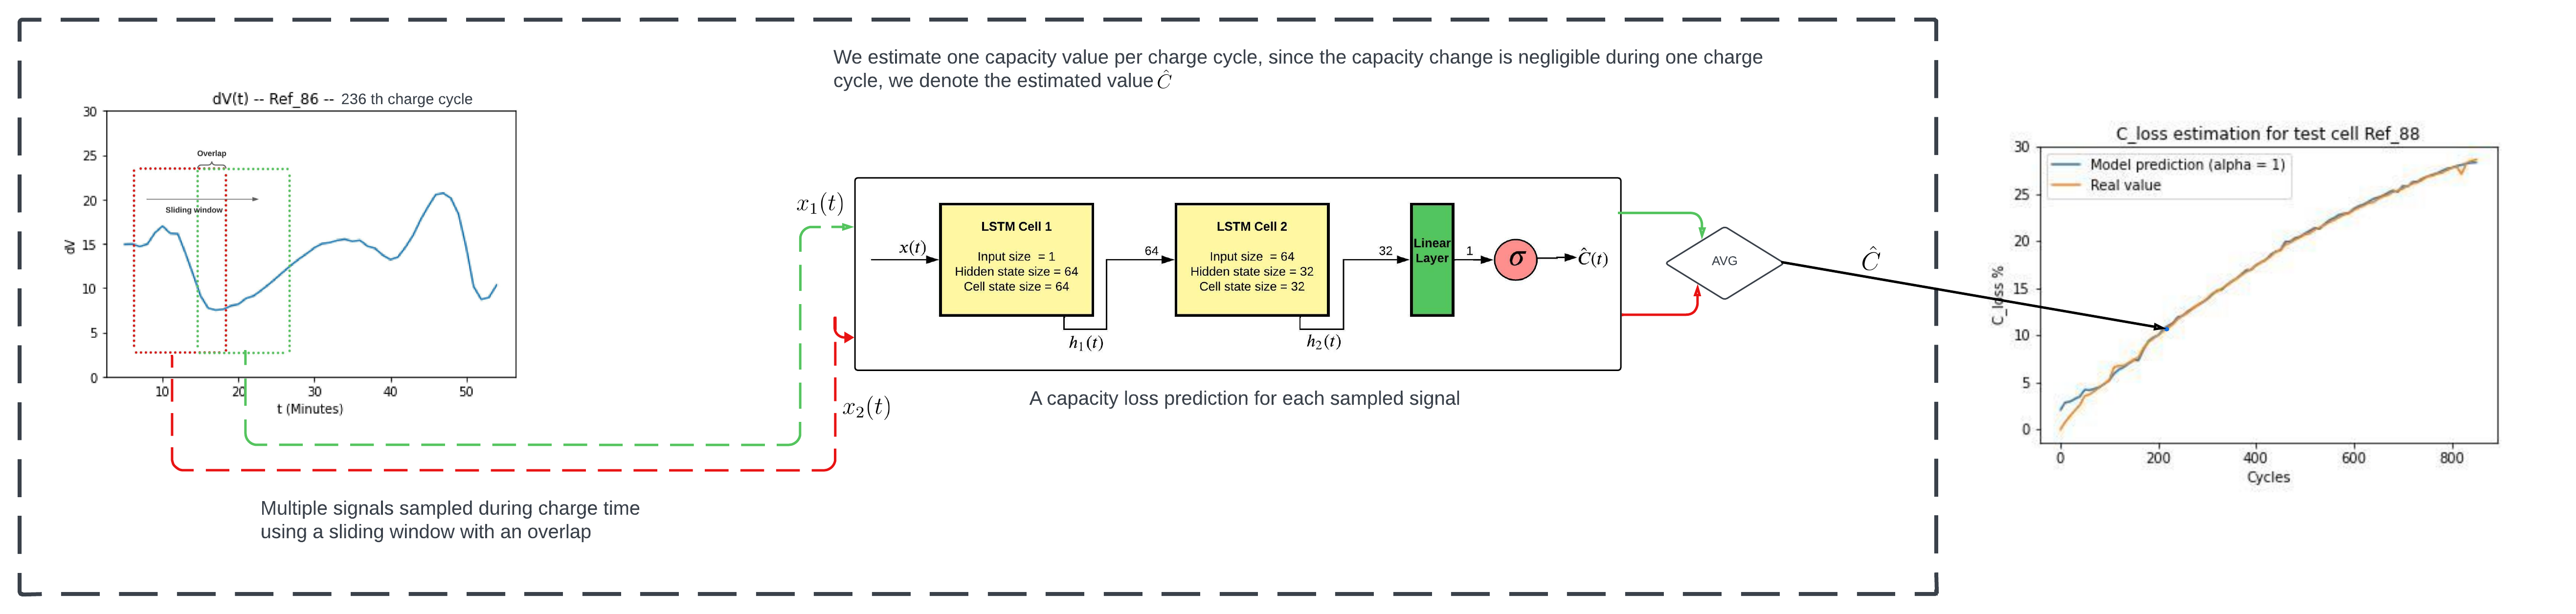
I implemented a real-time Lithium-Ion state of health estimation system during my internship at Serma Technologies. The project’s focus was on predicting battery cell capacity loss using signals from the charging process, with particular attention to the voltage first derivative. This choice was based on a comprehensive analysis that considered both the correlation with the target variable and the ease of capturing the signal.
The chosen architecture utilizes two Long Short-Term Memory (LSTM) cells followed by a final linear layer. The LSTM cells were preferred due to their ability to effectively capture and remember long-term dependencies in sequential data, aligning with the temporal nature of the charging signals.
The training process involves defining a fixed window size and sampling windowed versions of the input signal, specifically the voltage first derivative.
Proof of Concept Objectives:
The project served as a proof of concept, aligning closely with client expectations. The main objectives were to achieve satisfactory results in terms of real-time inference with minimal latency and accurate SOH estimations, particularly as the battery ages. Client feedback was actively sought, and adjustments were made iteratively to ensure the project met and exceeded expectations.
Hardware and Software Environment:
The model training and inference were conducted on a local machine. The machine featured a single P100 GPU, Intel Xeon CPU, and 16 GB of RAM. The software environment included Python 3.8, PyTorch 1.8, and other essential libraries, all versioned for reproducibility.
Reproducibility Measures:
To ensure reproducibility, a robust version control system, namely Git, was employed. The entire project, including code, data preprocessing scripts, and model training notebooks, was versioned. Rigorous testing procedures were implemented, with unit tests and integration tests validating the functionality at each stage of development. This meticulous approach ensures that the project’s outcomes can be reliably replicated by others.
Consideration of Client’s Compute Resources:
Acknowledging that the client possessed more computational resources than the machine used in training/inference, the project was designed with scalability in mind. Future iterations could seamlessly leverage additional compute resources even if it’s not needed in this particular application.
Deployment Considerations:
While the project was a proof of concept. Discussions on potential deployment scenarios were initiated, laying the groundwork for future transitions from proof of concept to real-world applications.
One of the proposed patterns involves deploying the model as a microservice (using a framework like Seldon core) on a cloud platform. In this scenario, the charging station would invoke this microservice upon completing the sampling of all input signals. The microservice, hosted on the cloud (ex: AWS Lambda), would conduct the inference, and the resulting prediction, along with pertinent information, would be seamlessly stored in a relational database (ex: Amazon RDS).
Communication with Stakeholders:
Regular communication channels were established with stakeholders, providing updates on project progress and soliciting feedback. This iterative feedback loop ensured that the final deliverables aligned closely with the client’s requirements and expectations.
Results
The implemented model demonstrated highly satisfactory performance across multiple key metrics:
Inference Latency:
For a chosen window size of 20 minutes (sampled at 1Hz) and on the local machine, the latency of the inference pipeline was found to be less than 30ms. This remarkable efficiency ensures that the capacity prediction process doesn’t impede the charging-discharging cycle, eliminating any waiting time after a full charge. The real-time nature of the system is crucial for maintaining the continuous operation of the battery without unnecessary delays.
Mean Absolute Error (MAE):
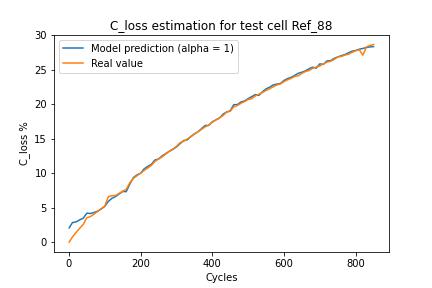
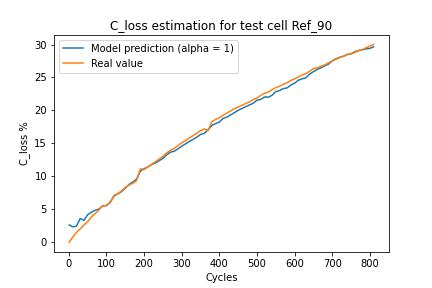
On the test cells, the MAE was measured at 1.3%. Importantly, after the 100th cycle, the MAE further improved to 0.39%. It’s noteworthy that the model faces challenges in accurately predicting the value 0 due to the sigmoid activation function in the last layer. However, this specific challenge is deemed less critical, as the primary focus is on the model’s performance as the battery undergoes aging. The model’s ability to deliver accurate predictions during the aging phase is paramount, and the achieved MAE values reflect its robust performance in this context.
| Test cell 1 | Test cell 2 |
|---|---|
 |  |